Thursday, December 11, 2014

Lab 12: Hyperspectral Remote Sensing

Background and Goal
The objective of this lab is to gain experience with the processing of hyperspectral remotely sensed data. Because hyperspectral images have many bands with specific wavelengths, it is common for several of the bands to be corrupt or incorrect from atmospheric influences as well as sensor error. It is necessary to detect these noisy bands and remove them from the processing. We then learned how to detect target features from the hyperspectral image.

Methods
For this lab we used Airborne Visible/Infrared Imaging Spectrometer (AVIRIS) data of a geologic field site in Nevada. The image consisted of 255 bands. Anomaly detection was used to compare results between an image that was not preprocessed and an image that had bad bands removed. Anomaly detection identifies pixels in the image that have a significant deviation of spectral signature compared to the rest of the image. First, we did an anomaly detection of the AVIRIS image without removing the bands. Then, we used the Bad Band Selection Tool to identify the bad bands within the image. Figure 1 shows this tool, with the bad bands highlighted. A total of 20 bands were removed. The two outputs of the anomaly detection function were then compared for differences.

Figure 1: The bad band selection tool, with the bad bands highlighted in red.

Next, we explored the use of target detection. This process creates a mask that highlights instances of a given spectral frequency (the target). For this lab, the target was the mineral Buddingtonite. First, we used a simple target detection method that used a spectral signature that was collected from a classified image. This would create a mask in much the same way the anomaly detection did, highlighting areas with the same spectral signature. Next, we used a spectral signature from the USGS spectral signature library and analyzed the two outputs for differences.

Results
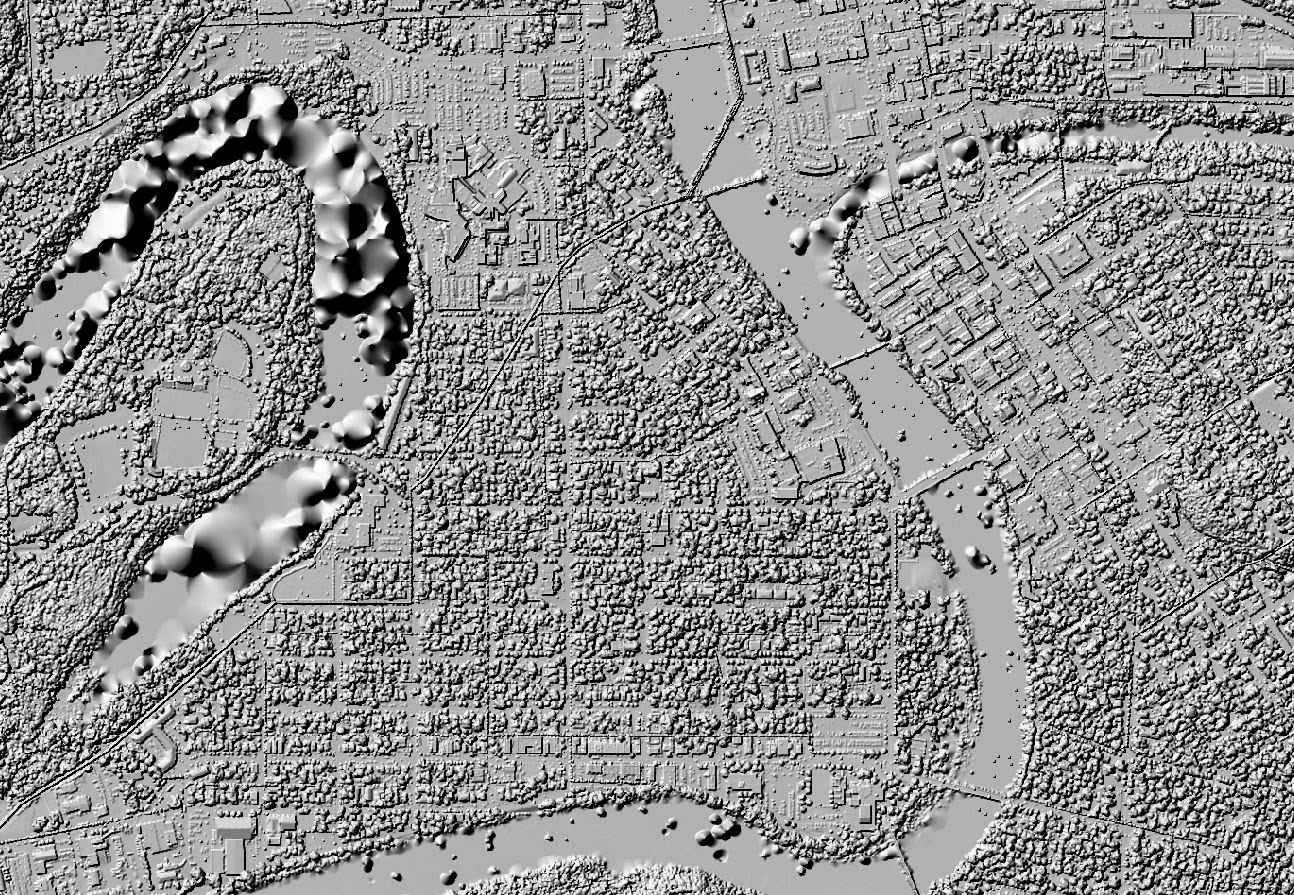
Figures 2 and 3 show the anomaly masks for the image without bands removed and the image with bad bands removed, respectively. There isn’t too much of a difference just by looking at them, but by using the swipe tool in the spectral analysis workstation, a difference was determined. After removing the bands, the anomalies were highlighted in the same area, however they were a little larger.

Figure 2: The anomaly mask of the image without the bad bands removed. 

Figure 3: The anomaly mask of the image with the bad bands removed. The anomalies are in the same spot, though they are slightly larger.


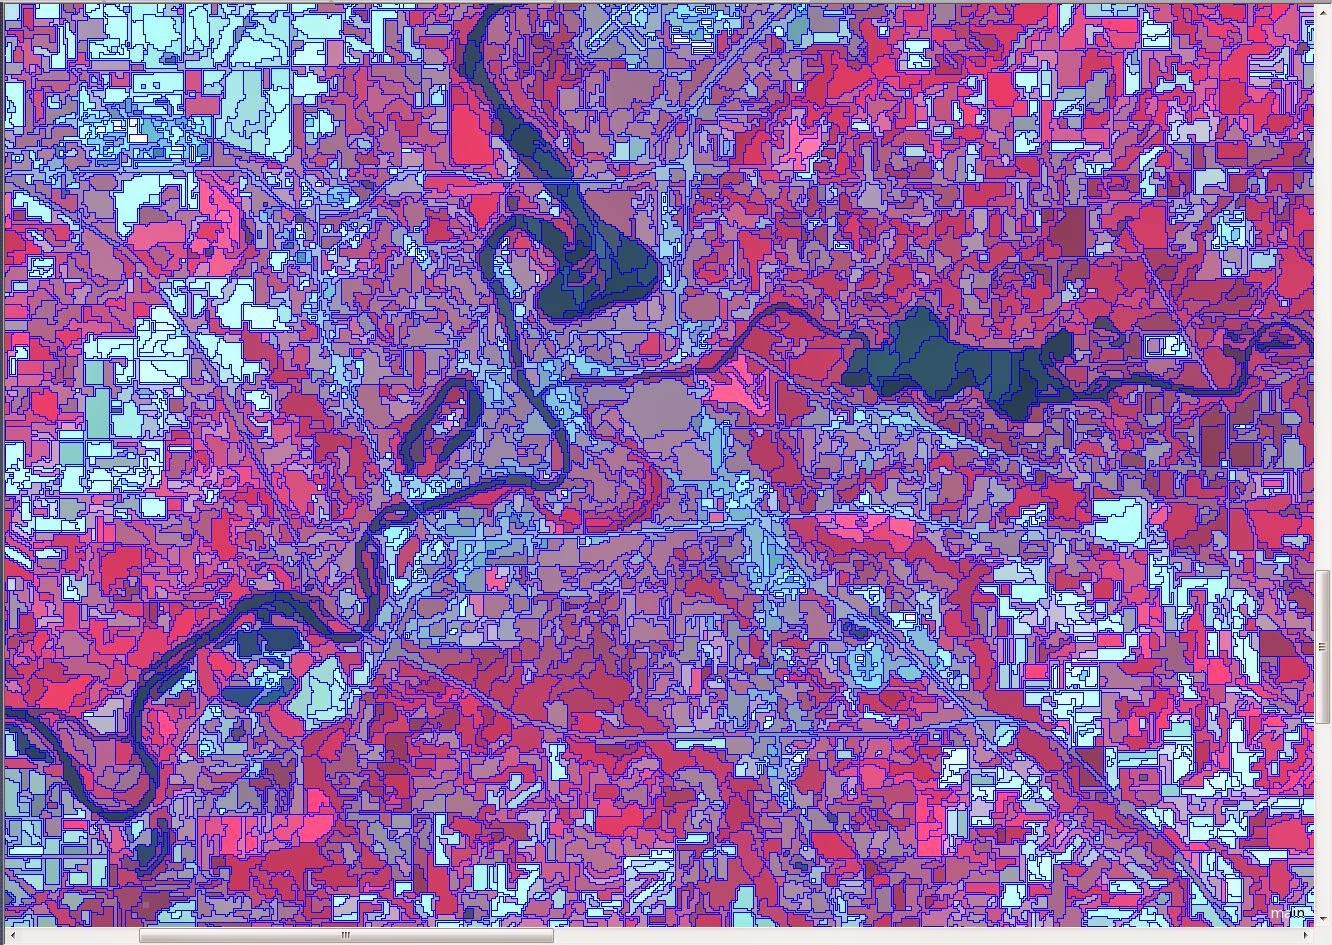
Figure 4 shows the results of the target detection overlay. There was an error with the simple target detection which just created a grey box for the target mask. The target detection with the USGS Spectral library signature worked just fine though. I’m guessing that the results of the simple target detection would show more spread and peppering, as the spectral signature was based off of a classification image.

Figure 4: The results of the overlay comparing the simple target detection and the spectral library target detection. There was an error with the spectral signature in the simple target detection, leaving only a grey box.

Sources
Erdas Imagine. (2010). [AVIRIS hyperspectral image]. Hexagon Geospatial. Obtained from Erdas Imagine 2010.


Tuesday, December 2, 2014

Lab 11: Lidar Remote Sensing

Background and Goal
Lidar is a rapidly expanding field in the remote sensing world. It has shown significant growth in recent years, due to its impressive and high tech nature. The main goal of this lab is to experience Lidar processing, as well as gaining knowledge of Lidar data structure. Specifically, we learn how to process and retrieve the different surface and terrain models and how to create derivative images from the point cloud. These images show first return hillshading (which gives a 3D looking, imitation aerial image), ground return hillshading (which reveals the elevation of the landscape itself), as well as intensity imagery (which shows a high contrast grayscale image, much like those of the Landsat panchromatic band).

Methods
The first step in Lidar processing is to create a LAS as Point Cloud file, and add the different LAS tiles within the study area. This was done within ArcMap, by creating a LAS dataset and adding the LAS files to the dataset. Because Lidar data is so big, the study area is composed of several LAS tiles. These files were then examined to determine if they are resembling the area of interest. This was done by looking at the Z values (or elevation) of the points. Since the minimum and maximum Z values matched the profile of Eau Claire, the data was determined to be useful. The dataset was then projected into the correct XY and Z coordinate systems by examining the metadata. Our data used the NAD 1983 HARN Wisconsin CRS Eau Claire projection for the XY coordinates, using feet as the unit. The NAVD 1988 projection was used for the Z coordinates, with feet as the unit as well. We then used a previously projected shapefile of the Eau Claire County to make sure that the dataset was properly projected.

Using the LAS Dataset Tool, we were then able to apply different filters to the dataset in order to further analyze the Lidar points. It was possible to examine the different classes that were assigned to each point (Ground, Building, Water, etc.), as well as elevation differences, slope ratios, and contour lines.

In order to create a Digital Surface Model (DSM), we used a LAS dataset to Raster conversion tool. It was necessary to adjust the sampling value so that it did not exceed the nominal pulse spacing. If the sampling value were finer than the nominal pulse spacing, the data would be inaccurate. This model used First Return points (points that are immediately reflected), to reveal the topmost surfaces of objects in the study area. This process created a black and white raster image, which was then converted into a hillshade image to give a 3D effect.

The production of a Digital Terrain Model (DTM) was executed in a much similar manner. This time, a filter was applied to use the Lidar points that were classified as Ground. This effectively removes buildings and vegetation from the DSM, leaving only the open earth. The process created a black and white raster image, which was then converted to a hillshade image to give a 3D effect. DTMs are very beneficial because they easily reveal the elevation patterns of the study area.

Lastly, an Intensity image was created. This image reveals the intensity of returns of the Lidar data. Areas with higher frequencies show up lighter on the image, while areas with lower frequencies show up darker on the image. This image was created using the same process as both the DSM and the DTM, but instead of measuring elevation, the process measured point intensity.

Results
Figure 1 shows the hillshade DSM image, Figure 2 shows the hillshade DTM image, and Figure 3 shows the Intensity image. Note the effects that water has on the images in all three figures. In the DSM and DTM, the water looks strange because of the lack of point density in those areas.

Figure 1: The DSM image. This image was created using first return points, so it is as if we are actually viewing the landscape from above.

Figure 2: The DTM image with hillshading applied. This image highlights the raw elevation differences throughout the study area, with little obstruction from vegetation and buildings.

Figure 3: The Intensity image. Urban surfaces are lighter because more pulses were reflected and thus returned. Vegetation and water are darker because more pulses were absorbed, so fewer returned.


Sources
Eau Claire County. (2013). [Lidar point cloud data]. Eau Claire County. Obtained from Eau Claire County.

Thursday, November 20, 2014

Lab 10: Object-based Classification

Background and Goal
In this lab, we learn how to utilize object-based classification in eCognition. This method of classification is state-of-the-art, and uses both spectral and spatial information to classify the land surface features of an image. The first of three steps in this process is to segment an image into different homogenous clusters (referred to as objects). This is then followed by selecting training samples to be used in a nearest neighbor classifier, an algorithm which is then used with the samples to create a classification output.

Methods
As stated previously, the first step in object-based classification is to segment the image into different objects. This is done by incorporating a false color infrared image into a multiresolution segmentation algorithm within eCognition’s ‘Process Tree’ function. For this classification, a scale parameter of 10 was used. This determines how detailed or broad the segments are. After this process is executed, it categorizes the different features in the image, splitting them as different objects. Figure 1 shows the different objects that were generated for the Eau Claire area.

Figure 1: An example of the segmentation that was created to differentiate between the different 'objects' of the image.

It is then necessary to create classes for the object-based classification. In the ‘Class Hierarchy’ window of eCognition, five different classes were inserted. The classes we used were Forest, Agriculture, Urban/built-up, Water, and Green vegetation/shrub. Each of these classes was assigned a different color. After this, the nearest neighbor classifier was applied to the classes, with the mean pixel value selected for the objects’ layer value. This will be the classifying algorithm for the process. Once this is complete, samples are selected in a much similar way to supervised classifications. Four objects in each class were selected and used as samples for the nearest neighbor classification. A new process was then created in the process tree, and the classification algorithm was assigned. Once this process was executed, the image becomes classified. It was then necessary to manually edit the image to change objects that had been falsely classified. The results were then able to be exported as an ERDAS Imagine Image file, to be further analyzed in a more familiar program.

Results
Figure 2 shows the result of the classification. This classification process was fairly simple to use, and produced beautiful results. Urban/built-up is still slightly under predicted, but overall the image looks quite accurate.
Figure 2: The final result of the object-based classification technique.

Sources
Earth Resources Observation and Science Center. (2000). [Landsat image of the Eau Claire and Chippewa Counties]. United States Geological Survey. Obtained from http://glovis.usgs.gov/


Thursday, November 13, 2014

Lab 9: Advanced Classifiers II

Background and Goal
In this lab, we learn about two more advanced classification algorithms. These algorithms produce classification maps that are much more accurate than those that are created with simple unsupervised and supervised classifiers. Specifically, this lab explores the use of an expert system classification (using ancillary data), and the development of an artificial neural network (ANN) classification. Both of these functions use very robust algorithms to create complex and highly accurate classification maps.

Methods
The use of expert systems is applied to increase the accuracy of previously classified images using ancillary data. In this lab, we used a classified image the Eau Claire, Altoona, and Chippewa Falls area (Figure 1). The map had the classes of Water, Forest, Agriculture, Urban/built up, and Green vegetation. In this classification map, Agriculture and Green Vegetation classes were over predicted. To use the expert system to correct these errors, it is first necessary to construct a knowledge base. Knowledge bases are built up of hypotheses, rules, and variables. Hypotheses are the targeted LULC classes, rules are the functions that will be used to classify the hypotheses, and variables are the inputs (previously classified image and ancillary data). For this lab, we created eight hypotheses. One was for water, one was for forest, one was for residential, one was for other urban, two were for green vegetation, and two were for agriculture. There are more hypotheses than classes because there must be a hypothesis for each correction. In the exercise, we broke the urban/built up class into ‘Residential’ and ‘Other Urban’, corrected green vegetation areas that were predicted as agriculture, and corrected agriculture areas that were predicted as green vegetation. The functions used bitwise language to classify the different hypotheses using the previously classified image and the ancillary data. Figure 2 shows the complete knowledge base. Once the knowledge base was complete, the classification was run producing a classification image with the eight hypotheses. These were then recoded into the six classes (basically just merging Green Vegetation with Green Vegetation 2 and merging Agriculture with Agriculture 2) complete the classification.

Figure 1: The original classified image of the Eau Claire, Altoona, and Chippewa Falls area.

Figure 2: The complete knowledge base. The hypotheses are on the left (green boxes), with corresponding rules on the right (blue boxes). There is a counter argument for each classifying argument.

ANN simulates the process of the human brain to perform image classification by ‘learning’ the patterns between remotely sensed images and ancillary data. It uses input nodes, hidden layers, and output nodes to bounce information back and forth and reveal the best answer based on the different Training Rates, Training Momentums, and Training Thresholds. In this lab, we used high resolution imagery of the University of North Iowa. To conduct the ANN classification, it was first necessary to create a training sample, by highlighting Regions of Interest (ROI). These ROI’s are essentially the classes that the image will be classified into. For this classification, the ROI’s were Rooftops, Pavement, and Grass. Figure 3 shows the reflective image with ROI’s highlighted. These ROI’s were then used as ancillary data in the ANN classification, with a Threshold of 0.95, a Training Rate of 0.18, and a Training Momentum of 0.7.

Figure 3: The image of UNI's campus overlayed with ROI's of grass (green), rooftop (red), and pavement (blue).

Results
The expert system classification produced a much more accurate image than the previous classified image. The image corrected the over prediction of agriculture and green vegetation, as well as creating two classes for the urban/built up class. Figure 4 shows the result of the expert system classification.

Figure 4: The result of the expert system classification method. It is much more accurate than the previous image.

The ANN classification was surprisingly easy to use, and produced an easily readable classification image. Figure 5 shows the results. It is easy to tell where the roads and the grass are. However, it classified the trees as rooftops (due to their shadows), and some of the rooftops were classified as pavement. Though the image isn't terribly accurate, it is surprisingly easy to distinguish between features, considering the work that the analyst has to do.

Figure 5: The classification image of the ANN classification method. Green areas are grass, blue areas are pavement, and red areas are rooftops.

Sources
Earth Resources Observation and Science Center. (2000). [Landsat image of the Eau Claire and Chippewa Counties]. United States Geological Survey. Provided by Cyril Wilson.

Department of Geography. (2003). [Quickbird High Resolution image of the University of Northern Iowa campus]. University of Northern Iowa. Provided by Cyril Wilson.

Thursday, November 6, 2014

Lab 8: Advanced Classifiers I

Background and Goal
The goal of this lab is to learn two advanced classification algorithms. These advanced classifiers are much more robust, and produce a classified image that is more accurate than those produced by unsupervised and supervised classifiers that were used in previous labs. The two algorithms that are learned in this lab are Spectral Linear Unmixing and Fuzzy classification. Spectral Linear Unmixing utilizes the measurement of ‘pure’ pixels (also known as endmembers) to classify images. Fuzzy classification accounts for mixed pixels in an image. Some pixels are a combination of several classes (due to spectral resolution) and thus membership grades are used to determine which class is more strongly identified within the pixel.

Methods
To conduct a spectral linear unmixing classification, it was first necessary to transform the image into a Principal Components (PC) image. This technique compiles all information into more compact bands, providing most of the image’s information within the first two to three bands in the PC image. This function was done with ENVI. For our image, most of the information was compiled in bands 1 and 2 of the PC image, with some information in band 3. To collect endmembers from the PC image, we created scatterplots of the informational bands. First, a scatterplot was generated with band 1 and the x-axis and band 2 and the y-axis. This created a scatterplot with a triangular shape. The points of this triangle are the ‘pure’ pixels (endmembers). These points were selected and turned into a class. The first scatter plot included the endmembers for water, agriculture, and bare soil (Figure 1 shows this scatterplot). However, to complete the classification, we also need endmembers for the urban class. We created a second scatterplot of bands 3 and 4 to collect these endemembers (Figure 1 shows this scatterplot as well). The endmembers are also highlighted on the reference image to make sure that the correct endmembers were selected (Figure 2). All of these endmembers were then exported into a region of interest (ROI) file and were then used in the Linear Spectral Unmixing function in ENVI, producing fractional maps for each endmember.

Figure 1: The scatterplots used to collect endmembers. The colors correspond to the colors in the reference map in Figure 2.

Figure 2: The reference map for collecting endmembers. The areas highlighted with green are the bare soil endmembers, yellow are the agriculture endmembers, blue are the water endmembers, and purple are the urban endmembers.

The processing for fuzzy classification was all executed within ERDAS. The first step is to select signatures from the input image. These signatures must be from areas where there is a mixture of land cover classes, as well as homogenous land cover. The aoi’s for the signature samples had to contain between 150 and 300 pixels. Four samples were collected for the water, forest, and bare soil classes, and six samples were collected for the agriculture and urban/built up classes. The samples for each of the classes were then merged, to create one aggregated sample for each class. These signatures were then used to create a fuzzy classification with ERDAS’ supervised classification function. This first function creates five layers of classified images, ranking the most probable classes for each pixel. A fuzzy convolution algorithm was then used in ERDAS to turn these layers into one classified image.

Results
Figures 3 through 6 show the results of the linear spectral unmixing function. The bare soil fractional map is quite accurate. It highlights the bare area surrounding the airport very well, as well as the empty crop fields to the east and the west. The fractional map for agriculture is a little less accurate. It seems to slightly highlight vegetation in general, and not just agriculture areas. The water fractional map is surprisingly inconsistent. Usually water is easy to classify, and it was classified well. However, the map also classified areas that were not water (notably the area around the airport). The urban fractional map worked surprisingly well. It successfully highlights the urban areas, but fails to leave other areas in the dark.

Figure 3: The Bare Soil fractional map.

Figure 4: The Agriculture fractional map.

Figure 5: The Water fractional map.

Figure 6: The Urban fractional map.

Figure 7 shows the final result of the fuzzy classification. This classification worked much better than the supervised classification in the previous lab, though the urban and agriculture classes were still over predicted.

Figure 7: The final result of the fuzzy classification.
Sources
Earth Resources Observation and Science Center. (2000). [Landsat image of the Eau Claire and Chippewa Counties]. United States Geological Survey. Provided by Cyril Wilson.


Thursday, October 30, 2014

Lab 7: Digital Change Detection

Background and Goal
The goal of this lab is to develop the knowledge and skills necessary to compute changes that occur over time using land use/land cover images. This digital change detection is important because it allows the monitoring of environmental and socioeconomic transitions that happen through time. In this lab we learn a couple techniques, from quick qualitative analysis to a statistical analysis and even a model that displays specific from-to changes between the different classes over time.

Methods
To do a quick qualitative change detection, we used a Write Function Memory Insertion technique. The study area was the surrounding counties of Eau Claire. For this change detection, we used band 3 from a 2011 image, and two copies of band 4 from a 1991 image. These images were then stacked using the Layer Stacking function. This new image was opened, and the layers were then adjusted so that the band 3 image would be viewed through the red color gun, while the band 4 images were viewed through the green and blue color guns. Since band 4 is black and white, while band 3 is red, this highlights any changes that occurred between 1991 and 2011.

Next we learned post-classification comparison change detection. For this exercise, we used images from 2001 and 2006 of the Milwaukee Metropolitan Statistical Area (MSA). This change detection technique calculates quantitative changes and is used to create a model that shows specific class changes between the two years. To quantify the land change, we examined the histogram values for each class in both of the images. In an Excel spreadsheet the different histogram values for all classes in both images were recorded and converted to hectares. The histogram shows how many pixels are within each class. For this specific sensor the spatial resolution is 30 meters, so one square pixel is 900 square meters. With this knowledge we were able to convert the histogram values to square meters. We then converted the values to hectares by multiplying the square meters by 0.0001. Figure 1 shows the class area data for both the years. A table was then created to calculate the percent change of square hectares for each class between 2001 and 2006.

Figure 1: The histogram data and conversion process for the 2001 and 2006 images.

To calculate specific from-to change between classes, we used a quite sophisticated model in ERDAS’ Model Maker. This model consisted of two input rasters, five pairs of functions, five pairs of temporary rasters, five more functions, and finally five output rasters. These were then connected as shown in Figure 2. The input rasters are the images from 2001 and 2006. For this exercise we are trying to reveal change from Agriculture to Urban, Wetlands to Urban, Forest to Urban, Wetland to Agriculture, and Agriculture to Bare Soil. These classes were extracted into the temporary rasters (in the respective order), using a Either IF OR function. This function assigns a 1 IF a pixel is the desired class, OR a 0 if a pixel is not the desired class, creating a binary model of the desired classification. In the next function, these binary models are overlapped using a Bitwise function. Areas that overlap are kept, while the rest are discarded (creating another binary model). This effectively reveals the specific areas of change between the two time periods, between the desired classes.

Figure 2: The complex model that was used for the from-to digital change detection.


Results
Figure 3 shows the final result for the Write Function Memory. This technique is quick an easy, thought it doesn’t create very concrete or specific results. All that you can do with the image is a visual examination to try and reveal areas of change. Figure 4 shows the final table for the quantitative analysis of the Milwaukee MSA. According to this table, Bare Soil shows the greatest change with a 23% increase in the five year period. Figure 5 Shows the final map of the from-to digital change detection method. From this model it is easy to see where change occurred in the study area. Waukesha County went through the most change, while Milwaukee County went through the least change.

Figure 3: The result of the Write Function Memory digital change detection technique. areas that are a light pink color show change between 1991 and 2011, while the red and white areas show no change.

Figure 4: The results of the quantitative analysis of change between 2001 and 2006 in the Milwaukee MSA. Bare Soil changed the most with an increase by 23.6%, while Wetlands changed the least with a decrease of 0.7%.

Figure 5: The results of the from-to digital change detection technique. Waukesha County saw the most change, while Milwaukee County saw the least.


Sources
Earth Resources Observation and Science Center. (1991). [Landsat image of counties surrounding Eau Claire]. United States Geological Survey. Provided by Cyril Wilson.

Earth Resources Observation and Science Center. (2011). [Landsat image of counties surrounding Eau Claire]. United States Geological Survey. Provided by Cyril Wilson.

Fry, J., Xian, G., Jin, S., Dewitz, J., Homer, C., Yang, L., Barnes, C., Herold, N., and Wickham, J., 2011. Completion of the 2006 National Land Cover Database for the Conterminous United States, PE&RS, Vol. 77(9):858-864.

Homer, C., Dewitz, J., Fry, J., Coan, M., Hossain, N., Larson, C., Herold, N., McKerrow, A., VanDriel, J.N., and Wickham, J. 2007. Completion of the 2001 National Land Cover Database for the Conterminous United States. Photogrammetric Engineering and Remote Sensing, Vol. 73, No. 4, pp 337-341.


Tuesday, October 28, 2014

Lab 6: Accuracy Assessment

Background and Goal
In this lab, we learned how to evaluate the accuracy of classification maps. This knowledge is important because it is a necessary post-processing exercise that highlights the strengths and weaknesses of a classification map. The results of accuracy assessments provide an easily read quality assessment and rating of the map as a whole, as well as each class within the map.

Methods
Accuracy assessments were completed for both the unsupervised classification model and the supervised classification model that were discussed in Labs 4 and 5 respectively. The process is identical for both assessments. The first step in this process is to generate random ground reference testing samples. These samples are either collected through field work with a GPS unit, or with a high resolution image. In this lab, we used a high resolution image as our reference for these testing samples. The testing samples were generated using ERDAS’ Accuracy Assessment tool. The classification map was to be assessed, using the high resolution image as a reference (this means that points would appear on the reference map, with the classification being applied to the classification map). Normally the total amount of testing samples should be equal to 50 for each class (meaning a minimum of 250 for 5 classes), but for the sake of time we only used 125 samples for our 5 classes. We used a stratified random distribution parameter to ensure a quality sample. Going further, we applied the use of minimum points, making sure that each class had 15 samples at the very least (this makes sure classes of smaller area are still factored into the accuracy assessment). Figure 1 displays the random testing samples on the high resolution image. Once the random testing samples were generated, each sample was located and a classification was applied. This classification would then be compared to the classification applied in the classification map in the accuracy assessment, creating a matrix to display an accuracy assessment report. 

Figure 1: All of the test samples that were used in one of the Accuracy Assessments. The points were randomly generated to reduce bias, and there are 125 points total.


Results
Figure 2 displays the accuracy assessment report of the unsupervised classification map, while Figure 3 displays the accuracy assessment report of the supervised classification map. The matrix displays the overall accuracy, Kappa statistic, producer’s accuracy, and user’s accuracy. The rows in the matrix list the classes that were actually classified on the classification map, while the columns display the classes that were selected with the reference points. The matrix thus displays producer’s accuracy (also known as omission error) and user’s accuracy (also known as commission error). Overall accuracy is the report of the overall proportion of correctly classified pixels in the image based on the reference sample. The Kappa statistic is a measure of the difference between observed agreement between two maps and the agreement that might be attained by chance (it calculates to what degree chance has a role in an accurate classification). A value below 0.4 means there is poor agreement while a value above 0.8 means there is a strong agreement. The producer’s accuracy is the accuracy for a given class that examines how many pixels on the map are classified correctly. The user’s accuracy is the accuracy for a given class that examines how many of the pixels on the classified image are actually what they say they are. Overall, the unsupervised classification map is more accurate, though neither maps are accurate enough to actually be used with accuracy.

Figure 2: The accuracy assessment report for the unsupervised classification map. The map has a low overall accuracy, a fairly low Kappa Statistic, and low producer and user accuracy (though it is slightly more accurate then the supervised classification map).


Figure 3: The accuracy assessment report for the supervised classification map. The map has a very low overall accuracy, and a much lower Kappa Statistic. Except for the case with Water, the producer's and user's accuracy are both awfully low. This map was not accurate whatsoever.


Sources
Earth Resources Observation and Science Center. (2000). [Landsat image used to create a classification map]. United States Geological Survey. Provided by Cyril Wilson.

National Agriculture Imagery Program. (2005). [High resolution image used for reference in accuracy assessment]. United States Department of Agriculture. Provided by Cyril Wilson.